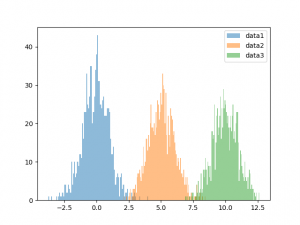
我们可以使用 pyplot 中的 hist() 方法来绘制直方图。
hist() 方法是 Matplotlib 库中的 pyplot 子库中的一种用于绘制直方图的函数。
hist() 方法可以用于可视化数据的分布情况,例如观察数据的中心趋势、偏态和异常值等。
matplotlib.pyplot.hist(x, bins=None, range=None, density=False, weights=None, cumulative=False, bottom=None, histtype=’bar’, align=’mid’, orientation=’vertical’, rwidth=None, log=False, color=None, label=None, stacked=False, **kwargs)
x:表示要绘制直方图的数据,可以是一个一维数组或列表。bins:可选参数,表示直方图的箱数。默认为10。range:可选参数,表示直方图的值域范围,可以是一个二元组或列表。默认为None,即使用数据中的最小值和最大值。density:可选参数,表示是否将直方图归一化。默认为False,即直方图的高度为每个箱子内的样本数,而不是频率或概率密度。weights:可选参数,表示每个数据点的权重。默认为None。cumulative:可选参数,表示是否绘制累积分布图。默认为False。bottom:可选参数,表示直方图的起始高度。默认为None。histtype:可选参数,表示直方图的类型,可以是’bar’、’barstacked’、’step’、’stepfilled’等。默认为’bar’。align:可选参数,表示直方图箱子的对齐方式,可以是’left’、’mid’、’right’。默认为’mid’。orientation:可选参数,表示直方图的方向,可以是’vertical’、’horizontal’。默认为’vertical’。rwidth:可选参数,表示每个箱子的宽度。默认为None。log:可选参数,表示是否在y轴上使用对数刻度。默认为False。color:可选参数,表示直方图的颜色。label:可选参数,表示直方图的标签。stacked:可选参数,表示是否堆叠不同的直方图。默认为False。**kwargs:可选参数,表示其他绘图参数。
matplotlib.pyplot.legend()生成显示图例:
import numpy as np
import matplotlib.pyplot as plt

data1 = np.random.normal(0,1,1000)
data2 = np.random.normal(5,1,1000)
data3 = np.random.normal(10,1,1000)
plt.hist(data1, bins=100,alpha=0.5,label='data1')
plt.hist(data2, bins=100,alpha=0.5, label='data2')
plt.hist(data3, bins=100,alpha=0.5, label='data3')
plt.legend()
plt.show()


最新评论